Luxembourg: municipalities in numbers
Luxembourg (province) has 43 municipalities and 296,370 residents across 4,459 km², or 66 people per km². Population: +5.7% between 2016 and 2026.
- 296,370 residents
- 43 municipalities
- 4,459 km²
- 66 people/km²

Map and records: Luxembourg
Population change over 10 years
All municipalities in Luxembourg
Click a column heading to sort the table.
| Municipality | Population | Population change over 10 years | Population density | Area | Share of inhabitants aged 65 and over | Share of inhabitants under 20 |
|---|---|---|---|---|---|---|
| Arlon | 31,440 | +7.4% | 264.1 people/km² | 119.1 km² | 16.6% | 21.6% |
| Bastogne | 21,010 | +10.2% | 79.4 people/km² | 264.7 km² | 16.8% | 23.9% |
| Marche-en-Famenne | 18,007 | +3.4% | 147.5 people/km² | 122.1 km² | 21.6% | 21.1% |
| Aubange | 17,845 | +7.2% | 387.0 people/km² | 46.1 km² | 15.9% | 23.3% |
| Libramont-Chevigny | 12,065 | +8.8% | 67.3 people/km² | 179.2 km² | 18.6% | 23.2% |
| Virton | 11,456 | +0.6% | 119.8 people/km² | 95.6 km² | 21.2% | 22.0% |
| Durbuy | 11,364 | −1.0% | 72.3 people/km² | 157.1 km² | 24.2% | 19.3% |
| Bertrix | 9,110 | +5.1% | 65.8 people/km² | 138.5 km² | 20.7% | 22.5% |
| Habay | 8,719 | +4.0% | 84.2 people/km² | 103.5 km² | 15.9% | 24.2% |
| Messancy | 8,637 | +6.9% | 164.1 people/km² | 52.6 km² | 17.7% | 23.1% |
| Neufchâteau | 8,388 | +12.0% | 73.3 people/km² | 114.5 km² | 15.9% | 25.6% |
| Vielsalm | 7,888 | +2.6% | 56.1 people/km² | 140.7 km² | 21.3% | 21.2% |
| Vaux-sur-Sûre | 6,384 | +16.0% | 47.0 people/km² | 135.7 km² | 13.6% | 26.2% |
| Etalle | 6,040 | +5.1% | 76.0 people/km² | 79.4 km² | 15.8% | 22.6% |
| Léglise | 5,903 | +14.0% | 34.0 people/km² | 173.7 km² | 12.0% | 27.4% |
| Attert | 5,824 | +7.6% | 81.9 people/km² | 71.1 km² | 15.5% | 24.5% |
| Saint-Hubert | 5,741 | +3.4% | 51.3 people/km² | 112.0 km² | 21.8% | 23.1% |
| Nassogne | 5,714 | +5.7% | 50.5 people/km² | 113.1 km² | 20.1% | 24.0% |
| Hotton | 5,699 | +4.2% | 99.9 people/km² | 57.0 km² | 20.7% | 22.4% |
| Florenville | 5,681 | +0.9% | 38.4 people/km² | 148.1 km² | 27.5% | 20.3% |
| Paliseul | 5,577 | +5.1% | 50.1 people/km² | 111.2 km² | 20.5% | 23.5% |
| Gouvy | 5,423 | +5.2% | 32.8 people/km² | 165.3 km² | 18.8% | 22.6% |
| Libin | 5,391 | +6.4% | 38.3 people/km² | 140.6 km² | 19.4% | 23.7% |
| Houffalize | 5,385 | +4.0% | 32.2 people/km² | 167.4 km² | 20.2% | 23.1% |
| Bouillon | 5,292 | −2.1% | 35.6 people/km² | 148.6 km² | 27.4% | 20.0% |
| Chiny | 5,222 | −0.2% | 45.8 people/km² | 114.1 km² | 20.6% | 21.8% |
| Musson | 4,715 | +5.2% | 133.3 people/km² | 35.4 km² | 16.8% | 24.6% |
| Tintigny | 4,635 | +8.9% | 56.6 people/km² | 81.9 km² | 16.5% | 24.6% |
| La Roche-en-Ardenne | 4,055 | −3.2% | 27.3 people/km² | 148.5 km² | 24.4% | 18.4% |
| Saint-Léger | 3,806 | +7.8% | 105.0 people/km² | 36.2 km² | 16.7% | 24.6% |
| Manhay | 3,778 | +11.8% | 31.4 people/km² | 120.2 km² | 18.6% | 23.4% |
| Erezée | 3,368 | +4.2% | 42.7 people/km² | 78.9 km² | 24.8% | 19.3% |
| Wellin | 3,241 | +7.1% | 47.8 people/km² | 67.9 km² | 23.7% | 20.9% |
| Tenneville | 2,872 | +3.0% | 31.2 people/km² | 92.0 km² | 20.9% | 22.3% |
| Meix-devant-Virton | 2,824 | +1.2% | 51.4 people/km² | 55.0 km² | 21.5% | 23.2% |
| Rendeux | 2,743 | +6.5% | 39.6 people/km² | 69.2 km² | 20.7% | 23.4% |
| Sainte-Ode | 2,706 | +8.5% | 27.6 people/km² | 97.9 km² | 18.6% | 24.4% |
| Fauvillers | 2,536 | +13.4% | 33.9 people/km² | 74.8 km² | 14.2% | 26.0% |
| Tellin | 2,519 | +2.4% | 44.2 people/km² | 57.0 km² | 20.6% | 22.8% |
| Martelange | 2,142 | +21.2% | 71.4 people/km² | 30.0 km² | 12.7% | 26.1% |
| Rouvroy | 2,097 | +0.1% | 74.6 people/km² | 28.1 km² | 22.1% | 22.9% |
| Herbeumont | 1,731 | +4.4% | 29.6 people/km² | 58.4 km² | 19.8% | 22.8% |
| Daverdisse | 1,397 | −4.1% | 24.6 people/km² | 56.9 km² | 24.1% | 22.1% |
Luxembourg compared with the national figures
Population-weighted averages for rates; totals for counts.
| Indicator | Luxembourg | Belgium |
|---|---|---|
| Share of inhabitants aged 65 and over | 19.0% | 20.7% |
| Share of inhabitants under 20 | 22.8% | 21.8% |
| Share of inhabitants of foreign nationality | 10.5% | 13.8% |
| Number of dwellings | 152,641 | 5,783,434 |
| VAT-liable enterprises | 23,440 | 1,170,010 |
| VAT-liable enterprises per 1,000 inhabitants | 79.1 ‰ inh. | 98.6 ‰ inh. |
| Net taxable income per inhabitant | 22,905 € | 23,352 € |
| Administrative poverty risk | 9.3% | 11.0% |
| Cars per household | 1.17 | 1.07 |
| Households without a car | 20.4% | 27.1% |
| New dwellings authorised per year per 1,000 inhabitants | 6.32 ‰ inh. | 4.28 ‰ inh. |
Frequently asked questions
How many municipalities are there in Luxembourg?
Luxembourg has 43 municipalities. The most populous is Arlon, with 31,440 residents.
What is the population of Luxembourg?
Luxembourg has 296,370 residents (2026), or 66 people per km².
Which municipality in Luxembourg is growing fastest?
Martelange has the fastest growth in Luxembourg over 10 years: +21.2%.
Other regions
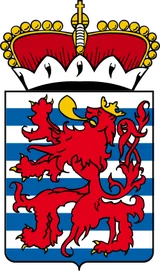
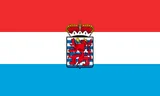
Coat of arms: Unknown, coverted to SVG by ChristianBier, Public domain, Wikimedia Commons · Flag: Flag_of_Luxembourg.svg: User:SKopp Coat_of_arms_of_the_Province_of_Luxembourg.svg: Unknown, Public domain, Wikimedia Commons. Coats of arms and flags are shown for identification only; this site is not affiliated with any public authority.

.svg)